Here we sit at week 9 of the NCAA D1 men’s season which means about 60% of the regular season is in the rearview mirror.
With 9 games worth of data to analyze we can now take a look at how the 2019 rule changes have impacted goalie play.
As a reminder, the 2019 rule changes in particular that modified the game for teams and goalies that I’m referring to are:
- 80-second shot clock
- 20-seconds to clear over midfield
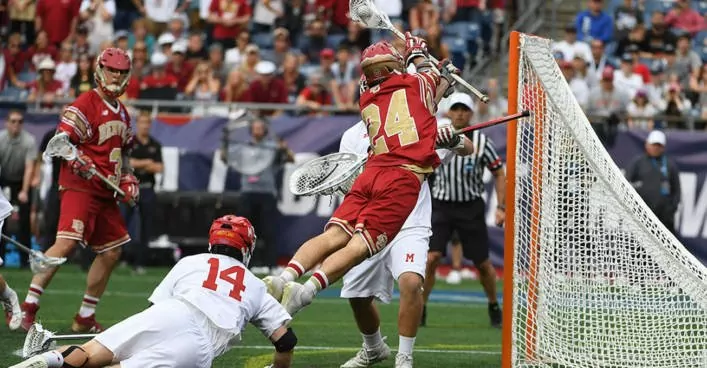
- “the dive” made legal
The theory when the rule changes were first announced was that a shot clock would result in more shots per game but many of those shots rushed resulting in more shots per game but also more save per game and ultimately a higher save percentage overall.
And with the re-introduction of the dive – a play tremendously difficult to defend for goalies – we might expect save percentage to drop a little as defending the dive is tough.
With 9 weeks of data under our belts, let’s dig in and see if those theories held true.
Data Set
The data I used was from NCAA Men’s lacrosse archive site – which keeps an awesome collection of historical stats for D1, D2 and D3 – even though this article just looks at Division 1 data.
In order to be included in these data a goalie must appear in at least 75% of his team’s total games played and play at least 60% of the team’s total minutes.
Therefore a goalie who comes in to play garbage time of a blowout game wouldn’t be included in this dataset.
That NCAA website has data all the way back to the 2002 season when James Amandola from Manhattan lead D1 in save percentage at 68.5%.
For the purposes of this article I looked at data going back to the 2006 season all for Men’s D1 lacrosse.
Want to look at the full data set? Check it here.
Shots on Goal Per Game
Based on logical thinking about the rules changes, it’s fairly obvious to expect a higher number of shots per game.
Brian Coughlin over at Inside Lacrosse did a study on the number of possessions per team per game which is up 20% with the introduction of the shot-clock and new clearing rules.
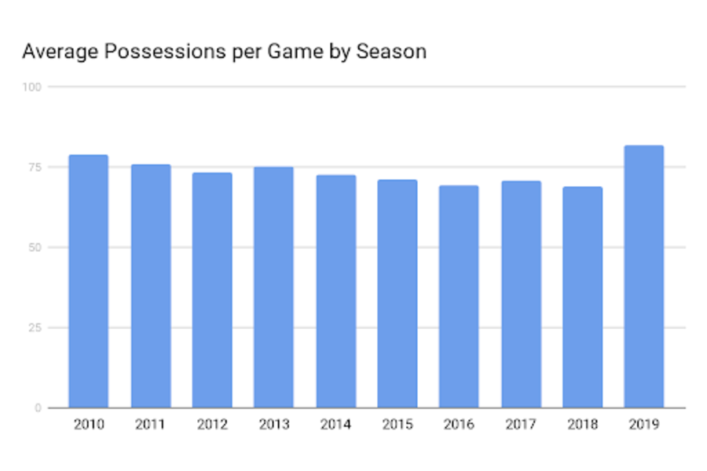
More possessions means more shots. And more shots means more Shots on Goal.
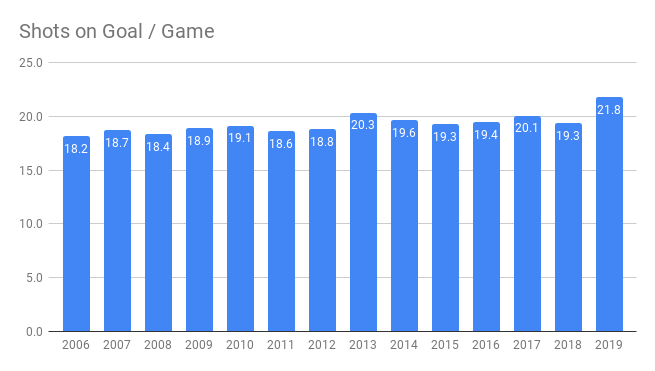
Teams are averaging 2.5 more shots on goal per game in the 2019 campaign.
A quick note – shots on goal I got from saves plus goals allowed and I think technically shots hitting the cross bar count as SOG’s. But you get the idea – more shots on goal in 2019.
Goals Given Up Per Game
With more shots on goal we should expect goalies and defensives to give up more goals per game too.
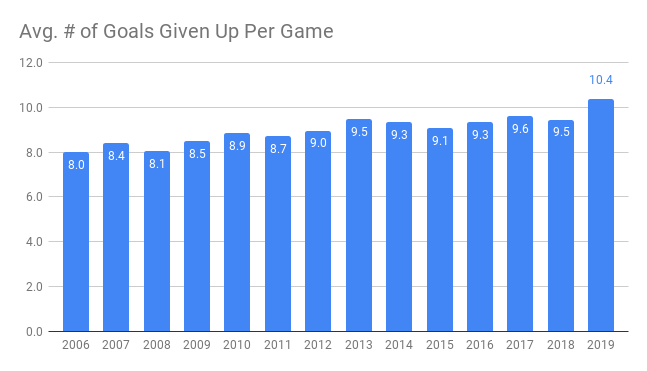
Such is the case as goalies are giving up almost a full goal more per game this year – almost a 10% increase.
You can see this number has slowly been trending upwards since 2006 as gear advancements have allowed players to shot harder and more accurate.
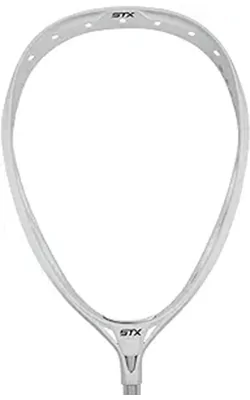
Meanwhile some goalies are still using the STX Eclipse (looking at you Jack Concannon) as their weapon of choice when that was the top goalie head back in 2006 too.
Saves Per Game
The theory is that even though a goalie with shot clock rules would face more shots many of them would be rushed as teams can no longer wait for a slam dunk scoring chance.
Does the data support that theory?
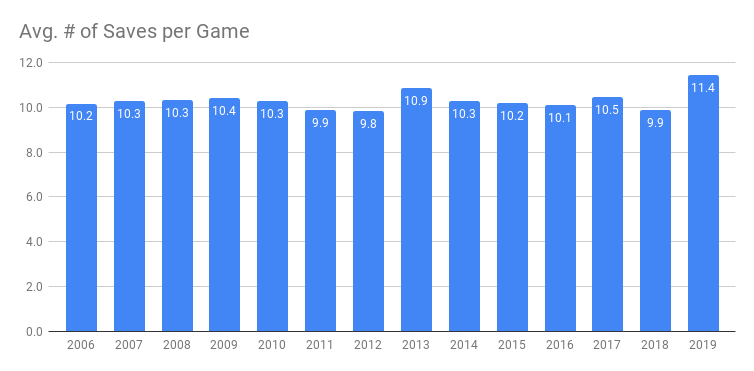
This year goalies are averaging 1.5 saves more per game compared to last season. That’s a 13% increase.
Interesting that with the exception 2013, average number of saves per game has been pretty consistent. Neither trending up nor down until Mr. Shot Clock arrived.
Average Save Percentage
We’ve already looked at saves per game and goals given up per game, the two ingredients to save percentage – but let’s take a look at the chart to see how save percentage changed.
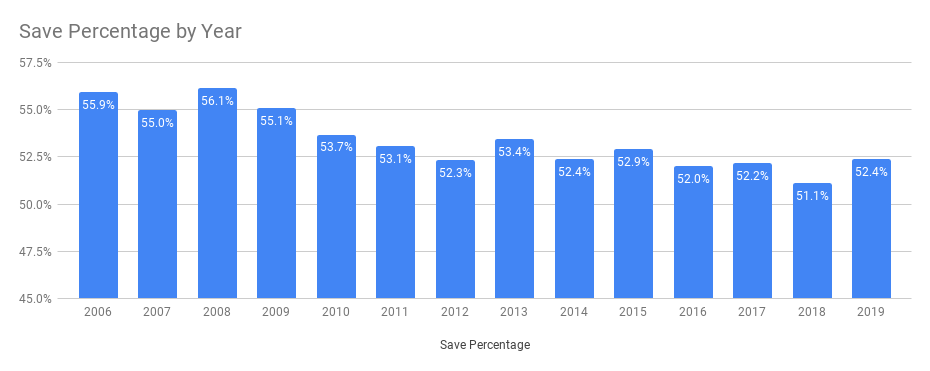
Unfortunately for us goalies, save percentage has been trending downwards since the 2006 season.
Save percentage for lacrosse goalies in 2019 currently sits at 52.4% which is a recovery from the previous year but still a long ways away from the 56.1% of 2008.
High goalie save percentage predicts stock market crashes? You heard it here first on Lax Goalie Rat.
Jokes aside while both goals per game and saves per game have gone up, the goalie’s save percentage for this year has gone up a little.
Will be interesting to see data for remainder of year and also going forward.
Another cool thing to take a look at is the save percentage of the goalie leading the league in that category.
| Save Percentage of #1 Rank | Goalie | Year |
| 63.7% | Sean Sconone | 2019 |
| 60.9% | Nick Washuta | 2018 |
| 66.1% | Benny Pugh | 2017 |
| 60.7% | Jack Kelly | 2016 |
| 61.4% | Garrett Conaway | 2015 |
| 64.2% | Jason Weber | 2014 |
| 66.2% | Dillon Ward | 2013 |
| 63.7% | John Kemp | 2012 |
| 63.5% | Austin Kaut | 2011 |
| 60.5% | Scott Rodgers | 2010 |
| 66.3% | Scott Rodgers | 2009 |
| 67.4% | Jordan Burke | 2008 |
| 64.1% | Nick Sciubba | 2007 |
| 65.3% | John Geagan | 2006 |
In chart form we get this – 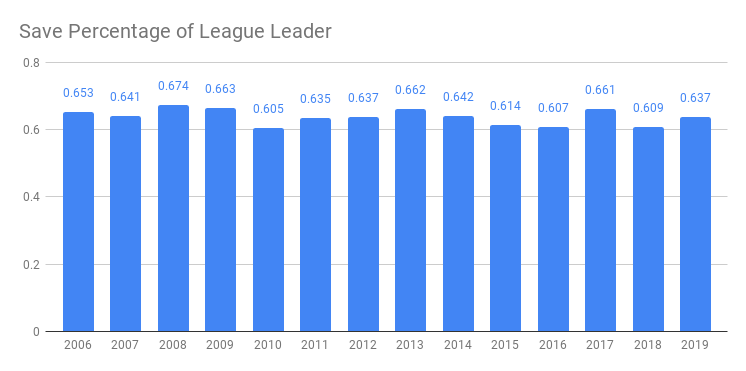
Pretty consistent year over year however do you notice this year’s league leader (Sean Sconone of Massachusetts) is about 3 percentage points higher than last year’s leader (Nick Washuta of Vermont).
Jordan Burke‘s 67.4% in the 2008 is the highest dating back to 2006.
Conclusion
With the introduction of a shot clock and the dive, the lacrosse world knew a few things would happen.
- More shots on goal
- More goals
- More saves
- Better save percentage
9 weeks into the season and looking at real data we have shown that indeed is the case.
Goalie’s save percentage has gone up a little since last year after trending downward for 13 seasons.
Until next time! Coach Damon


 14 Amazing Lacrosse Goalie DrillsAug. 1, 2024
 Quick Guide To Lacrosse Slang TermsApril 14, 2025
 Lacrosse Goalies Rules To KnowJune 28, 2022
 Lacrosse Goalie Step-by-Step Guide to Getting RecruitedFebruary 6, 2022
 18 Lacrosse Goalie Drills to Improve Your GameApril 24, 2025
 7 Elements of a Great Lacrosse Goalie StanceAug. 1, 2020
 12 Lacrosse Goalie Tips To Take Your Game to the Next LevelSeptember 10, 2024
 STX Eclipse 3 Goalie Head ReviewApril 24, 2025
 Lacrosse Goalie WorkoutAug. 12, 2019
 The Basics of Making a SaveJune 29, 2021






















The only thing I would suggest adding is injury rate after the season is over, for both the goalies and the field players. Other than that great post!
Good suggestion although I’m not sure that data is readily available.